
SmartGantt
SmartGantt provides a timeline view of your CORAS data — displaying list items as bars on a schedule based on start and end dates. For program offices tracking acquisition milestones, maintenance schedules, or readiness timelines, it transforms list data into an interactive schedule where you can spot delays, overlaps, and dependencies at a glance. Combined with conditional formatting, it gives leadership the same kind of timeline visibility used across Navy program offices for flight hour forecasting and shipyard planning.
Why This Matters
Leadership shouldn't have to read a status report to know what's delayed. A well-configured SmartGantt makes it visible — red bars where things are off track, green where they're not, before anyone has to ask.
Acquisition programs, maintenance windows, and readiness schedules all live in timelines. SmartGantt puts your CORAS data on one without requiring a separate tool or a manual export.
Embed it in a SmartBoard alongside a SmartLanes relationship view and leadership sees the full picture — what's happening and when, and how everything connects.
SmartGantt or SmartLanes — Which Do I Need?
If you're not sure which tool fits your task, use this before you start configuring anything.
Use SmartGantt when time and sequence matter — you need to see when things happen and whether they're on track.
Use SmartLanes when relationships and structure matter — you need to see how things connect and whether there's overlap or redundancy.
Both can be embedded in a SmartBoard dashboard so leadership sees timeline and relationship views side by side.
If you need SmartLanes instead, see SmartLanes — Configuration Guide.
Create a SmartGantt
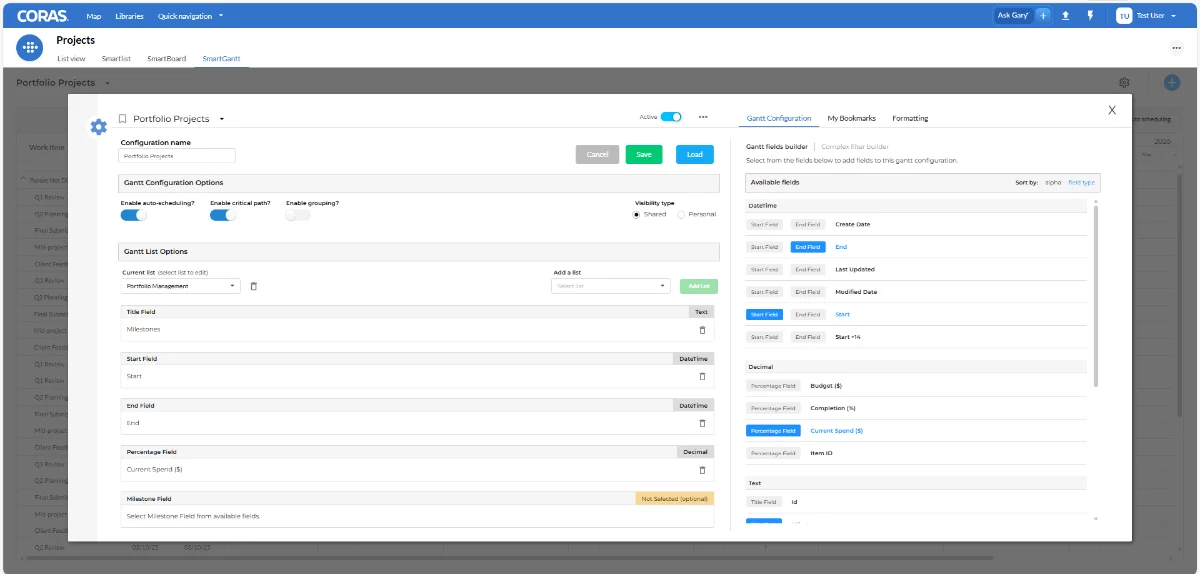
Before you start, confirm the list you want to display already exists in CORAS and includes at least three fields: a title field, a start date field, and an end date field. If those fields aren't in your list, add them before continuing.
Navigate to the SmartGantt tab in your node or collection
Click the gear icon in the top-right corner to open the configuration panel
Enter a name in the Configuration Name field — something that identifies which list and timeline this configuration is for
Under Add a List, click the dropdown and select the list containing the items you want to display
Click Add List to confirm — the list will appear in the configuration panel
Assign the three required fields:
Title Field: Select the field that contains the item name.
Start Field: Select the field representing the start date.
End Field: Select the field representing the end date.
Select any optional fields you want to display alongside the timeline bars
Click Load to generate the timeline
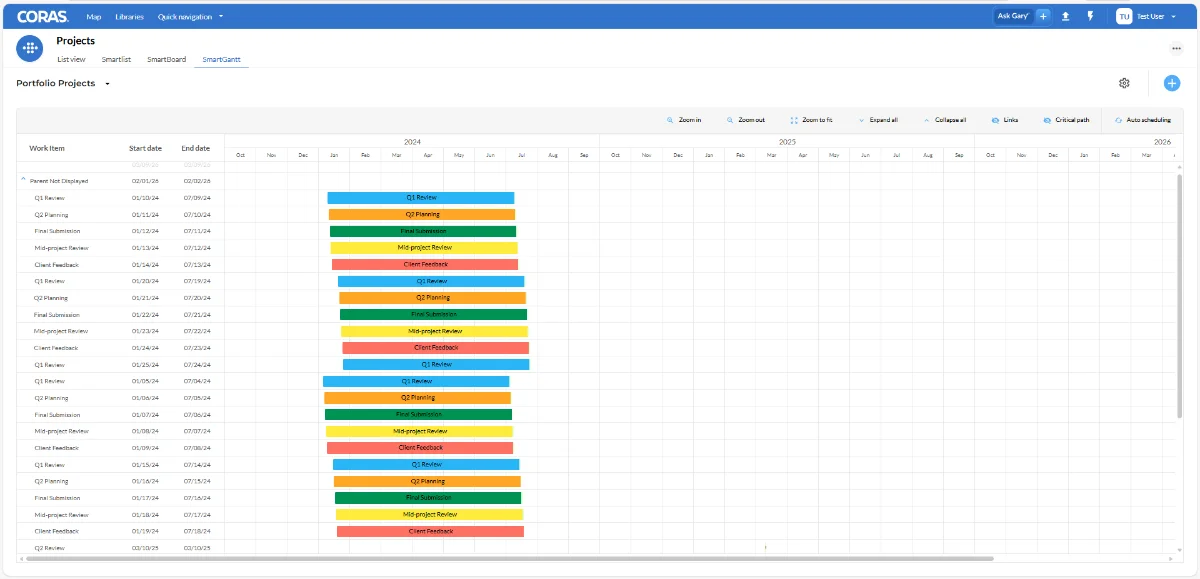
Each item from the selected list will display as a horizontal bar on the timeline, positioned between its start and end dates.
Apply Formatting
Formatting rules color-code your timeline bars based on field values — making status, priority, or risk visible without anyone having to read individual records.
Click the gear icon in the top-right corner — the same gear icon used for configuration
Select Formatting, then Field Formatting
Select the field you want to base the rule on — for example, Status or Priority
Define a condition — for example, is equal to — and enter or select the value to match — for example, Delayed
Assign a color to items that match this condition — for example, red for Delayed
Click + Add Rule to add another condition — for example, green for On Track
Repeat until all relevant values have a color assigned
Click Load to apply
Items matching each condition will display in the assigned color on the timeline.
Get Help
Contact your Customer Success Manager or visit the Customer Resource Center for additional support with SmartGantt configuration.