
SmartList
SmartLists are the configurable data views where teams enter, track, and manage the structured information that powers everything else in CORAS — from SmartBoards to SmartLanes to every insight GARY produces. Consistent fields, clear statuses, and accurate data give your entire organization a shared operating picture.
Why This Matters
GARY is only as good as the data he can see. Inconsistent fields, missing values, and unclear statuses produce mediocre analysis. A well-configured SmartList produces decision-ready outputs.
Views let one list serve multiple audiences without duplicating data. Leadership sees a summary view. Analysts see full detail. Program managers see their action items. All from the same underlying list.
What You Can Do
Configure which fields are visible and how data is displayed
Create multiple views tailored to different audiences
Apply conditional formatting to make status visible at a glance
Add inline actions, group rollups, and complex filters for deeper analysis
Generate charts and visualizations directly from your list data
Run What-If scenarios to model changes before committing
Before You Begin
You'll need a list configuration before you can work with a SmartList. Start here:
Step 1: Create a list configuration
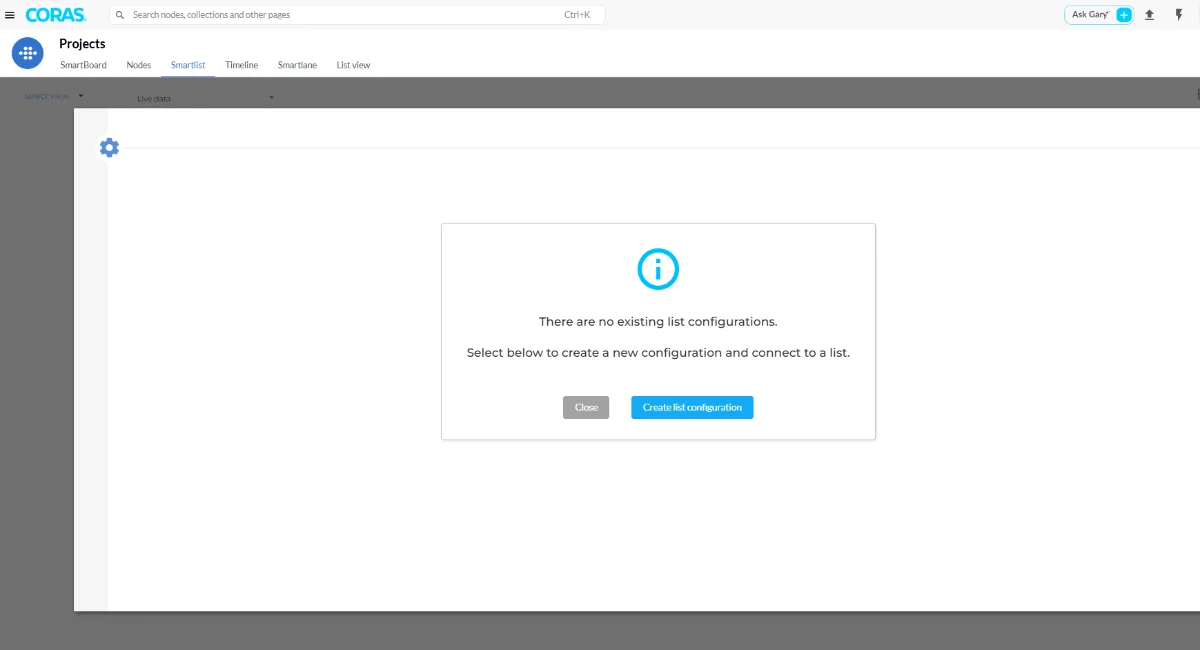
When you first enter SmartLists, click Create List Configuration from the landing screen.
Step 2: Choose your list and fields
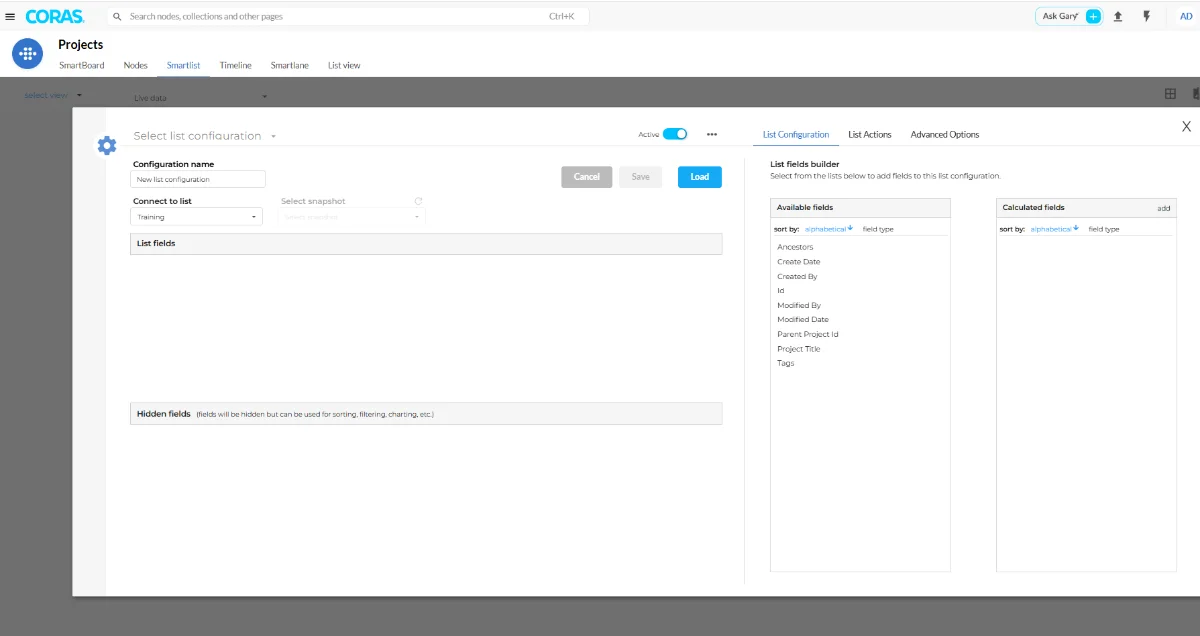
Select the list for your configuration. Available fields for that list display on the right side.
Step 3: Select and configure fields
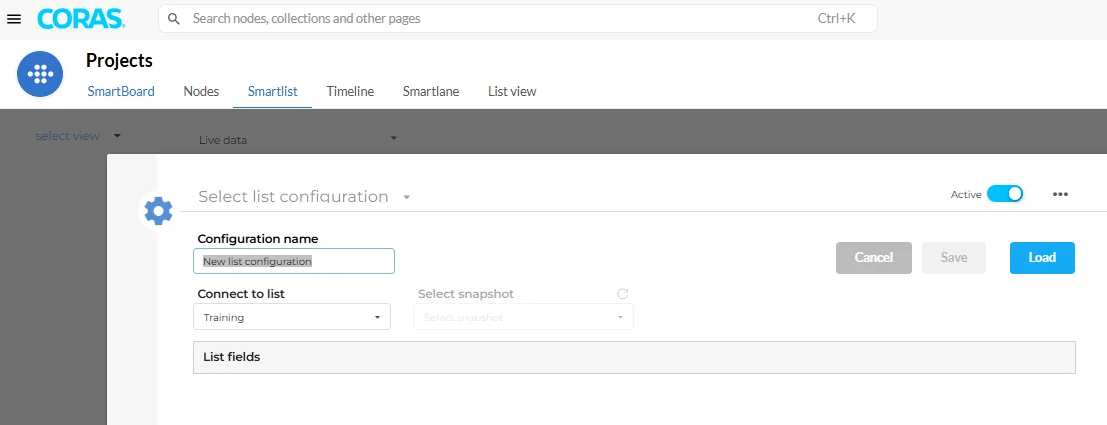
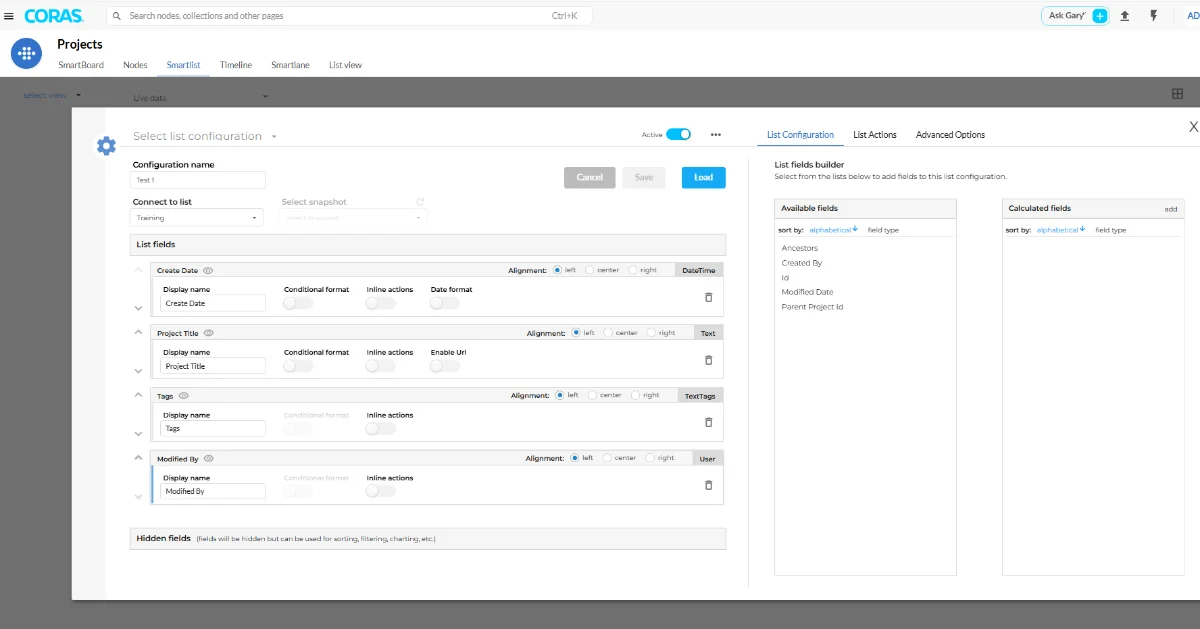
Choose the fields you want displayed. After selecting them you can:
Change the display name by typing in the box
Adjust field order using the arrows on the left side
Toggle a field active or inactive
Click Load when finished
To download or delete the configuration, use the three-dot menu.
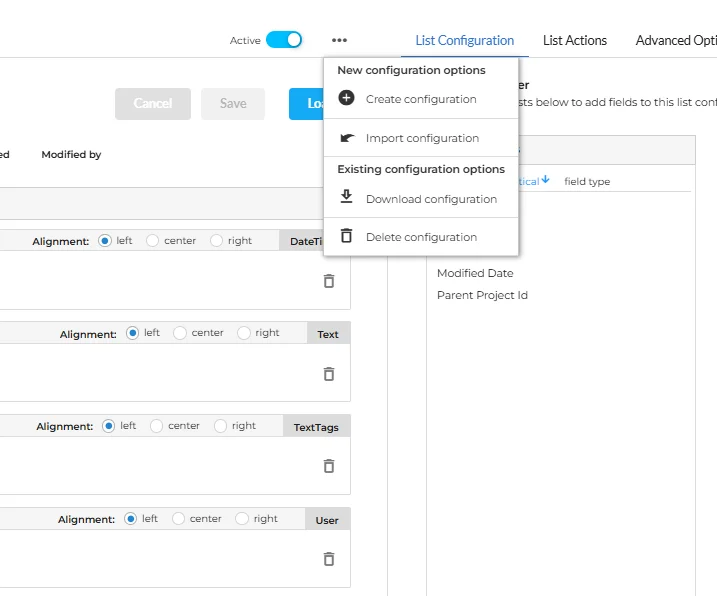
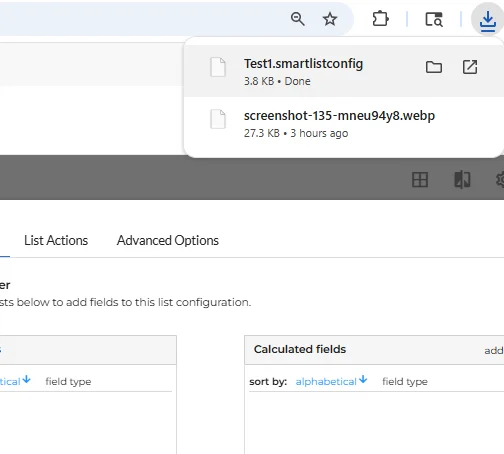
Downloading saves the configuration locally so you can reuse it when creating configurations in other nodes or collections.
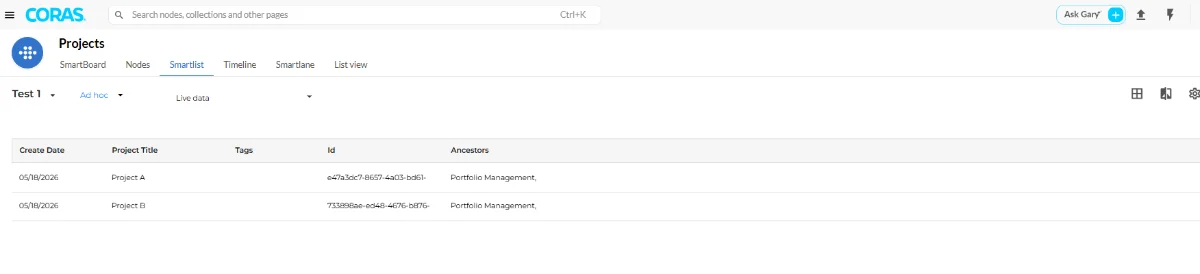
Step 4: View your configured list
Once loaded, all selected fields and their corresponding data display as columns in the SmartList.
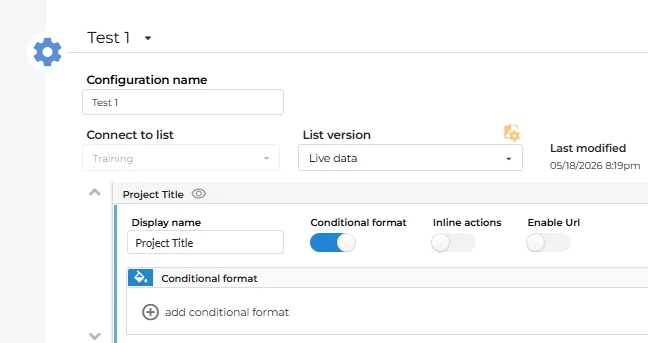
Conditional Formatting
Toggle the conditional format option, then click the plus sign (+) to add a conditional format.
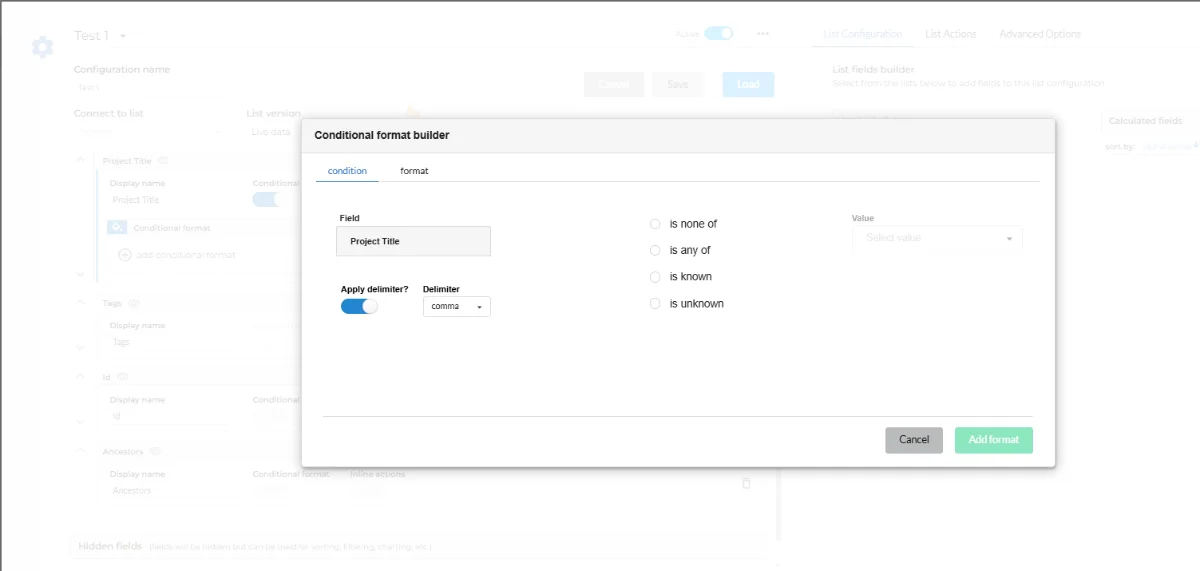
Select Apply Delimiter and choose the option that fits your needs (for example, comma), then choose the value it applies to.
Open the Format tab and select the desired color. Click Save Format.
After saving the color, you should see the updated result.
Click Load to display the field using the selected color.
Inline Actions
Attach icons or symbols to field values to flag status, risk, or attention items without relying on color alone.
Toggle on Inline Action, then click Add Action
Click Build Icon to open the customization panel
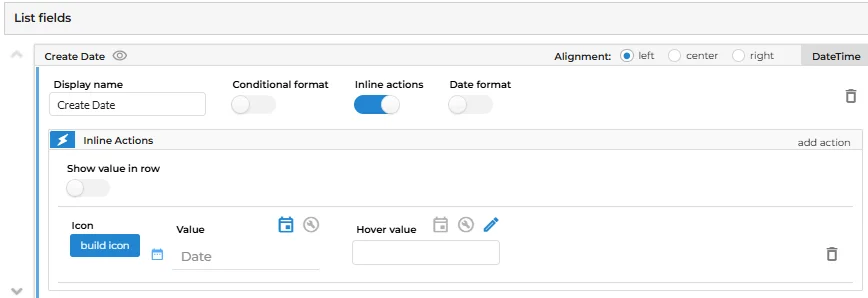
Select the icon you want to use
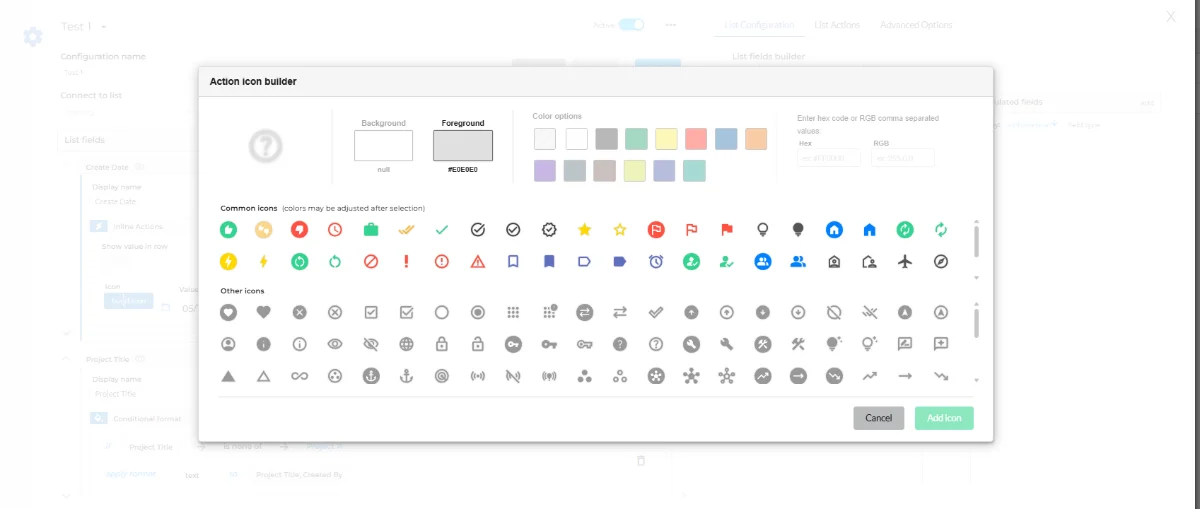
Click Add Item, choose background and foreground colors, then click Add Icon
Assign a value to the icon
Click Save or Load to apply
The inline action is now built and ready to use.
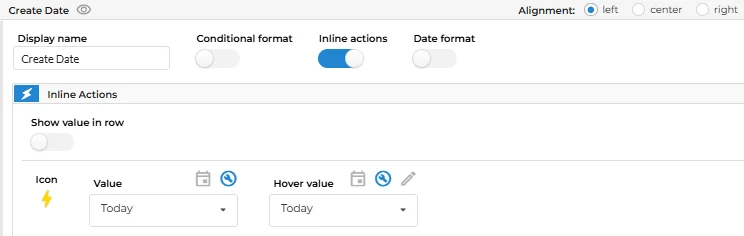
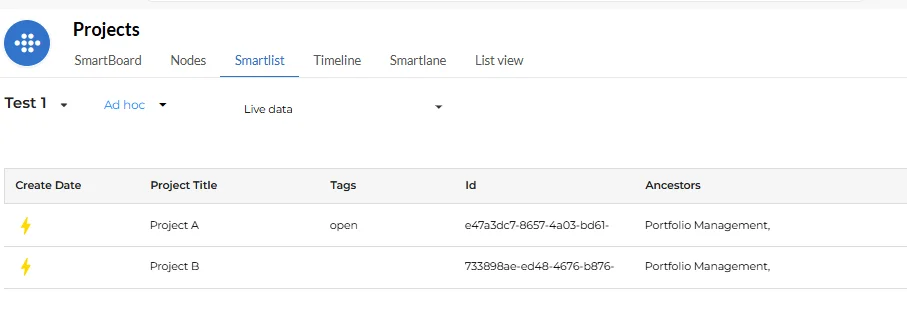
You can add multiple inline actions to a single configuration. Inline actions can also be saved as templates for reuse across other SmartList configurations.
Group Rollup
Aggregate numeric values across grouped items — useful for budget tracking, funding totals, and financial analysis.
To set it up, toggle the Group Rollup option and enter the required details such as:
Name
Rollup type
Prefix
Format
Once complete, Click Load. The rollup result appears once your view and grouping are configured.
Complex Filters
Display only records that meet specific conditions — useful for narrowing a large list to what matters for a particular task or briefing.
Click the Complex Filters tab
Select the field you want to filter
Apply the filter condition and choose the value (e.g. filter the Revenue field to show values greater than 5000).
Click Add Filter
The filter is now applied, and the view should display only data matching that condition.
Stack multiple filters to narrow results further.
Grouping
Organize your SmartList by a specific field to compare and analyze items by category, status, team, or mission area.
For example, sales data might include fields such as Product, Region, Salesperson, and Date. Grouping by Region makes it easier to compare sales across different locations.
Click Create View and give the view a name
Select a field from the grouping category
Click Load
Example
In the example, the view is named Notional Sheet 3 and grouped by the Category field.
Create multiple views with different grouping configurations and switch between them without losing your settings.
What-If
Model changes to your data before committing. GARY runs the scenario against your live data without altering your actual records.
Click the Live Data dropdown above your configuration and select What-If.
Charts
Generate charts directly from your list data — no export required.
Basic Charts
Open the Charts tab and toggle Enable Charts
Click Add Chart, choose a chart type, and enter a name
Select a theme: Light, Dark, FiveThirtyEight, or PowerBI
Fill in axis titles, axis fields, and aggregation type
Click Save and Load
To view the chart, use the icon in the upper-right corner. You can add up to 4 charts per view in any combination of basic and custom types.
Custom Charts
CORAS also supports custom charts for specialized visualization needs.
Documentation is available for many chart types, including examples and code to help guide your configuration.
Start with the chart code from CORAS documentation
Copy it into the JSON Editor and modify for your field names and requirements
Return to the Charts tab, select Custom Chart, paste your configuration, and click Load
Key Options
Key Functionality Description Use Case Import Configuration Import configuration from your own machine and/or cloud. Useful in team settings where consistent settings across all machines improve collaboration and reduce confusion. Exporting Data You can export Smartlist data into Excel. Helpful when data needs to be presented or analyzed separately outside CORAS. Data Visualization Smartlist transforms your data into visually appealing charts and graphs. Visuals are often easier to interpret than raw data and can support better decision-making. Smartlist can also prepare data before creating a Smartboard.
Import Configuration - Import a saved configuration from you machine or cloud storage
Export Data - Export SmartList data to Excel for analysis outside CORAS
Download Configuration - Save the current configuration locally to reuse in other nodes or collections\
FAQs
Can I create views only visible to me? Yes. In View Configuration, select My View. The view stays private until you choose to share it.
How many charts can I add per view? Up to 4 in any combination of basic and custom chart types.
Can I add multiple inline actions to one configuration? Yes — and you can save them as templates for reuse across other configurations.
I don't see my charts. You may be in the wrong view. Open the view selector and confirm the correct view is active.